Financial Statements
July 1, 2023 to June 30, 2024
Horizontal Analysis of Financial Statements
| 2023-24 | % | 2022-23 | % | 2021-22 | |
|---|---|---|---|---|---|
| Assets | |||||
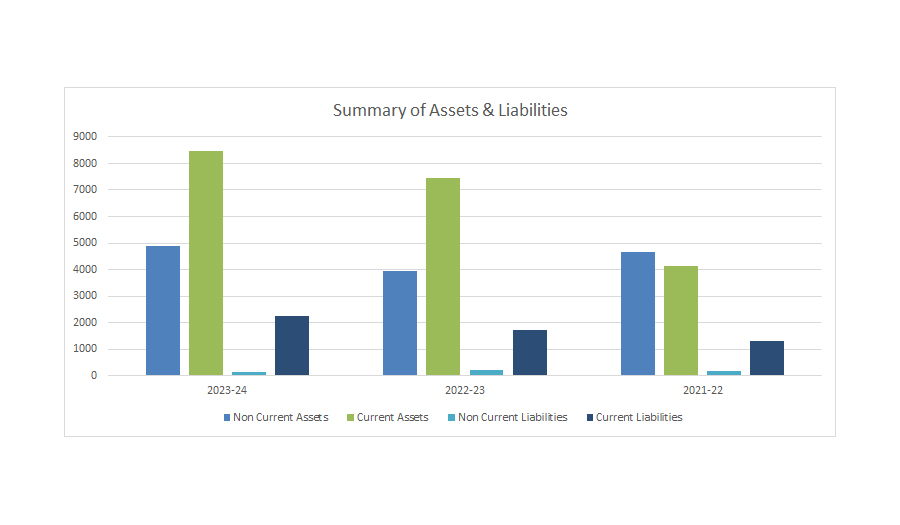
| Non Current Assets | 4882 | 23% | 3962 | -15% | 4642 |
| Current Assets | 8461 | 14% | 7453 | 80% | 4140 |
| Total | 13343 | 11415 | 8782 | ||
| Fund Balance and Liabilities | |||||
| Non Current Liabilities | 120 | -42% | 207 | 11% | 186 |
| Current Liabilities | 2241 | 31% | 1714 | 32% | 1299 |
| Fund Balance | 10982 | 16% | 9494 | 30% | 7296 |
| Total | 13343 | 11415 | 8782 | ||
| Fund Balance | |||||
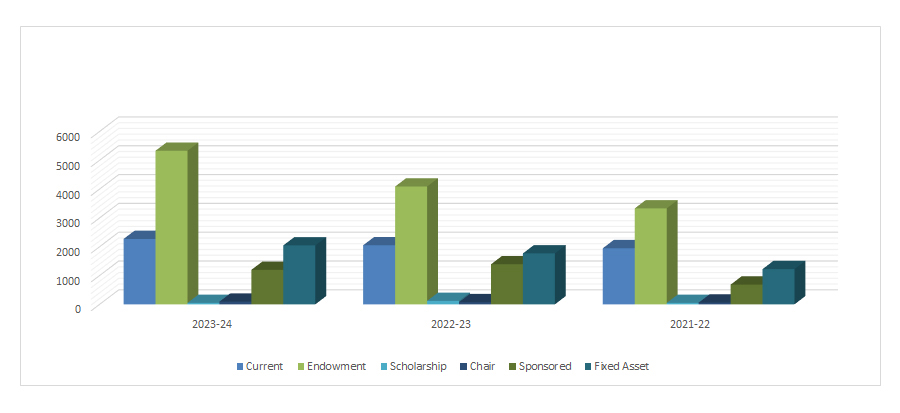
| Current Fund | 2269 | 11% | 2051 | 5% | 1948 |
| Endowment Fund | 5329 | 30% | 4090 | 23% | 3329 |
| Scholarship Fund | 50 | -58% | 119 | 141% | 49 |
| Chair Fund | 93 | 25% | 75 | 21% | 62 |
| Sponsored Fund | 1196 | -14% | 1390 | 103% | 685 |
| Fixed Asset Fund | 2045 | 16% | 1769 | 45% | 1223 |
| Total | 10982 | 9494 | 7296 | ||
| Income and Expenditure | |||||
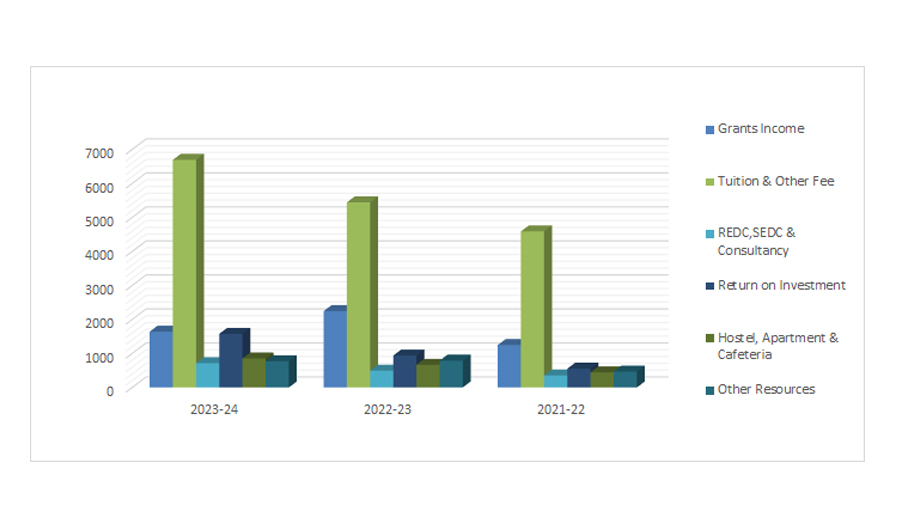
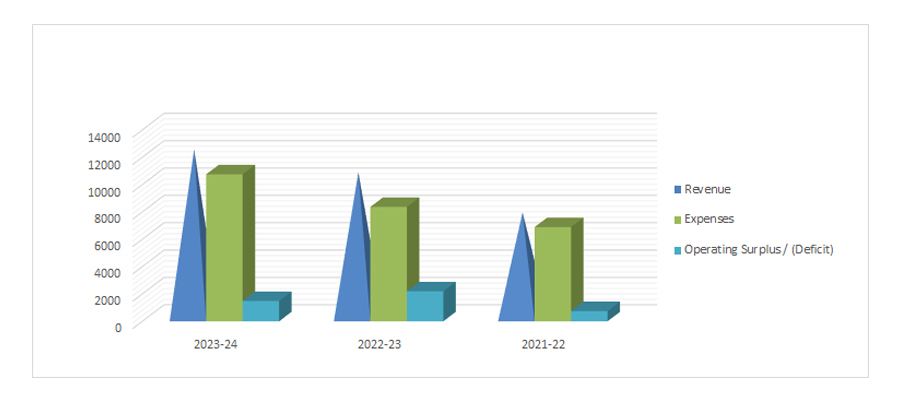
| Income | 12241 | 16% | 10567 | 38% | 7643 |
| Expenditure | 10753 | 28% | 8369 | 21% | 6891 |
| Surplus | 1488 | -32% | 2197 | 192% | 752 |
Vertical Analysis of Financial Statements
| 2023-24 | % | 2022-23 | % | 2021-22 | |
|---|---|---|---|---|---|
| Assets | |||||
| Non Current Assets | 4882 | 37% | 3962 | 35% | 4642 |
| Current Assets | 8461 | 63% | 7453 | 65% | 4140 |
| Total | 13343 | 100% | 11415 | 100% | 8782 |
| Fund Balance and Liabilities | |||||
| Non Current Liabilities | 120 | 1% | 207 | 2% | 186 |
| Current Liabilities | 2241 | 17% | 1714 | 15% | 1299 |
| Fund Balance | 10982 | 82% | 9494 | 83% | 7296 |
| Total | 13343 | 100% | 11415 | 100% | 8782 |
| Fund Balance | |||||
| Current Fund | 2269 | 21% | 2051 | 22% | 1948 |
| Endowment Fund | 5329 | 49% | 4090 | 43% | 3329 |
| Scholarship Fund | 50 | 0% | 119 | 1% | 49 |
| Chair Fund | 93 | 1% | 75 | 1% | 62 |
| Sponsored Fund | 1196 | 11% | 1390 | 15% | 685 |
| Fixed Asset Fund | 2045 | 19% | 1769 | 19% | 1223 |
| Total | 10982 | 100% | 9494 | 100% | 7296 |
| Income and Expenditure | |||||
| Income | 12241 | 100% | 10567 | 100% | 7643 |
| Expenditure | 10753 | 88% | 8369 | 79% | 6891 |
| Surplus | 1488 | 12% | 2197 | 21% | 752 |
Summary of Assets and Liabilities
Summary of Funds
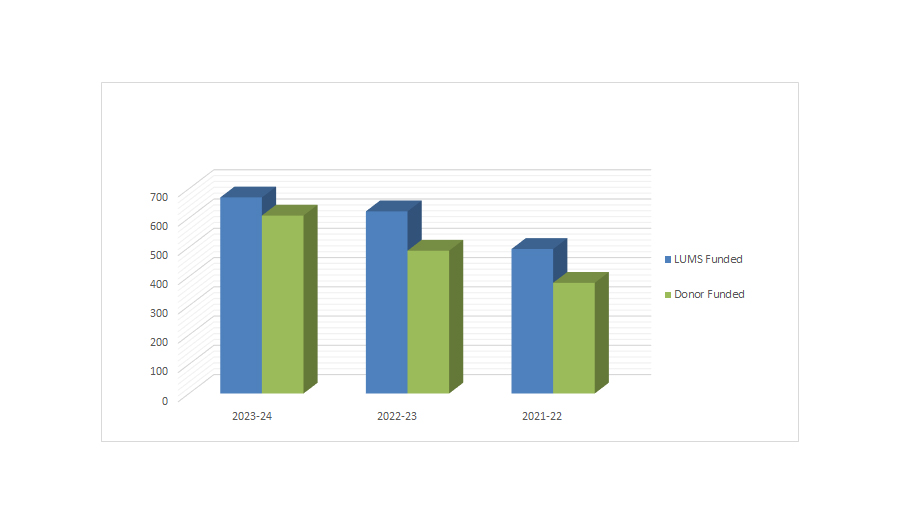
Scholarships Disbursements
Revenue and Expense Comparison
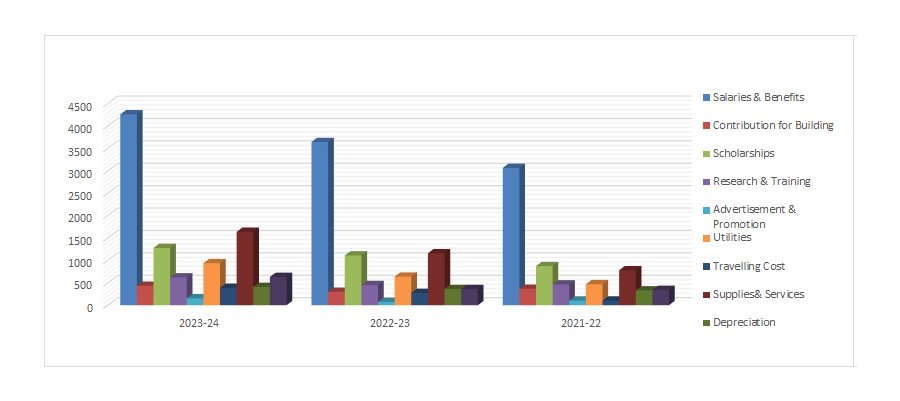
Expense Composition
Revenue Composition